A recent challenge in the EDPX 4010 course was to connect an Arduino device via a serial port to control a p5.js sketch. In this case, we’re working with the Arduino-compatible MicroView module that is included in this SparkFun Inventor’s Kit. I wanted to explore the p5 sound library further, so I made a simple device that controls the playback speed of an audio file (between 0 – 3x) with a potentiometer, and can also loop a chosen section of the audio file using pushbutton controls.
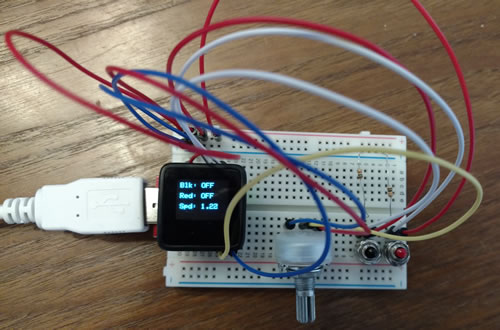
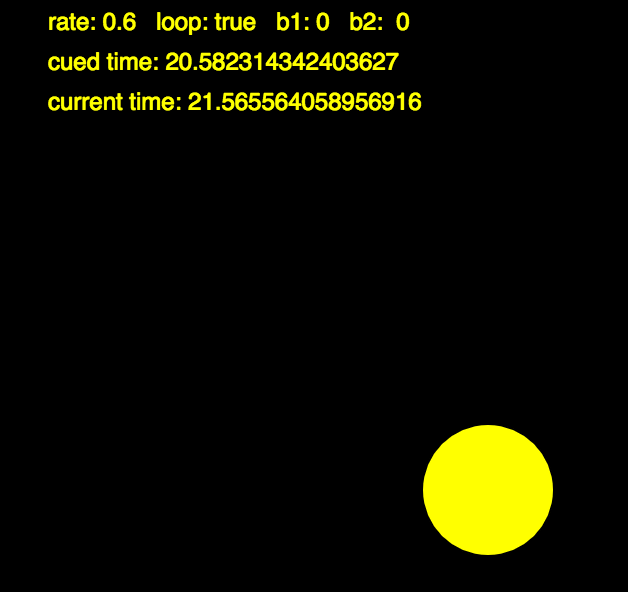
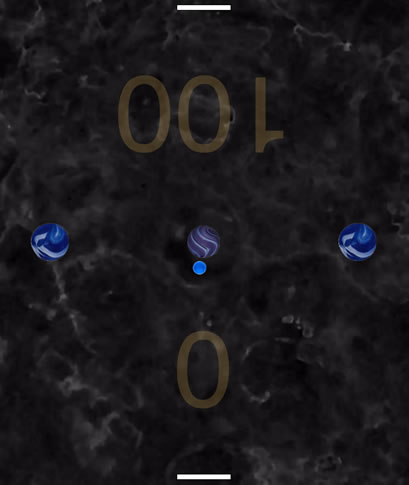
Pressing the black button sets the start point of the looped segment, and the red button sets the end point and begins the looped playback of that segment. Pressing the red button again will set another end point in the loop and shorten the looped segment even more, and the black button will stop the looping and continue the playback normally. The MicroView screen displays the playback speed of the audio and the status of the black and red buttons. The p5 screen (above right) displays the current playback rate, whether looping is on or off (true or false), the status of the pushbuttons, the start (cued) time of the loop, and the current time of the audio file’s playback. The size of the yellow circle changes based on the playback rate. The p5 source code for the project is available here, and the MicroView/Arduino source code is here.
For the serial port connection, I used the p5.serialport library, and also the p5.serialcontrol GUI application to perform the actual serial communication, since JavaScript in a browser can not interact directly with a serial port. To run this sketch, you must first open the serialcontrol application and then run the p5 sketch. Basically, the MicroView is sending three values as a comma-separated text string through the serial port: the “digitalRead” state of the two buttons (0 or 1), and the “analogRead” value of the potentiometer, mapped to 0-255. The p5 sketch receives this text and parses the values with the split command, separating by commas. The sketch then uses those values to affect the playback speed and looping parameters. It also contains some logic checks to prevent repeated triggering if a button is held down, so that a held push is registered as only one push and is not continually changing values (this technique is known as “state change” or “edge” detection).
Some glitches with the p5.sound library – before the playback of a loop begins, the library first stops the playing state, sets the loop cue times, and then restarts playing, which creates an audible short pause in the process. Also, I initially had the potentiometer control the direction as well as the speed, so that the audio could be played in reverse. However, the library seems to reset the playback point to the beginning of the file before it begins the reverse playback, so the forwards/backwards control does not sound seemless, always starting from the same point in the file. I’m interested in digging further into the code of the library itself to see if I can change that behavior.
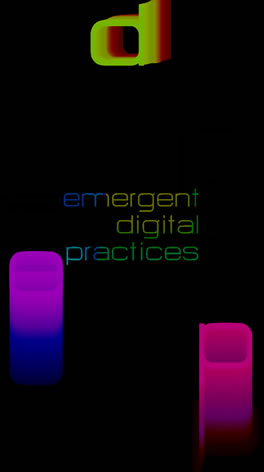 This sketch was created as a final project for the EDPX 4010 Emergent Digital Tools course . The assignment was to create a visual generative piece using p5.js that somehow incorporates the EDP program logo. The project will then be displayed on a large LCD screen in the program’s office as part of a collection of digital art works.
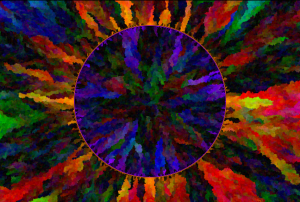 …well, “unbearable” might be a stretch. But when compared to running native Processing sketches in Java, the difference is certainly noticeable. While experimenting with potential approaches for the final generative art project in EDPX 4010, I was very inspired by Asher Salomon’s “Evolution” sketch in OpenProcessing: