Noises & Signals

Contemplations on creativity in our digital age

Category: Assignments

p5 EDP logo project

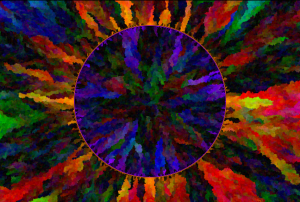
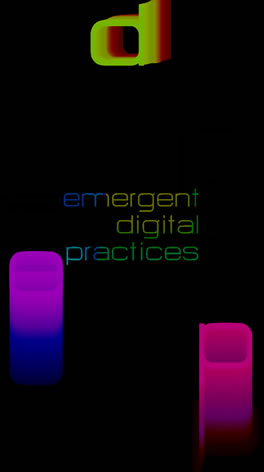
edp_p5_screenshot_smThis sketch was created as a final project for the EDPX 4010 Emergent Digital Tools course . The assignment was to create a visual generative piece using p5.js that somehow incorporates the EDP program logo. The project will then be displayed on a large LCD screen in the program’s office as part of a collection of digital art works.

After experimenting (unsuccessfully) with other ideas based on inspiring sketches found on OpenProcessing, I took an approach for this project that would run over longer periods of time at a reliable frame rate, avoiding the speed limitations that I’ve encountered using p5 & JavaScript for more complex sketches. Each single letter of edp is controlled by noise-influenced parameters affecting their position, scale, hue and brightness. The descriptive text in the background is “painted over” by the larger letters, and will fade and shift position after about a minute. To achieve a clean trailing effect, rather than using a transparent background which causes a visual artifact of “ghost trail” images, I used a suggested technique of initially capturing a close-to-black image of the empty canvas, and then blending that image to each new frame using the DIFFERENCE (subtractive) blending mode.

The project can be viewed in its full 1920×1080 dimensions here, and the p5 JS source code can be viewed here. The target display that this will be running on is rotated 90 degrees clockwise, hence why this sketch appears sideways here.

The Unbearable Slowness of p5-ing

evol1…well, “unbearable” might be a stretch. But when compared to running native Processing sketches in Java, the difference is certainly noticeable. While experimenting with potential approaches for the final generative art project in EDPX 4010, I was very inspired by Asher Salomon’s “Evolution” sketch in OpenProcessing: https://www.openprocessing.org/sketch/15839, which created a very cool watercolor-esque painting effect. My initial attempts at porting Salomon’s code to p5/JavaScript resulted in an abysmally slow rendering rate…nothing even close to the original sketch. After a lot of further exploration and changes, I finally reached a more respectable speed, though not something that could be used in a large canvas of 1920×1080. My p5 results can be viewed here, and the source code is here. Some important discoveries:

1 – Instead of the get() and set() methods used in the original (which are still available in p5/JS), getting and setting pixel colors via the pixels[] array is faster. loadPixels() and updatePixels() need to be included for this approach to work. Dan Schiffman’s “Pixel Array” tutorial video was incredibly helpful in understanding this process – in particular, setting the pixelDensity value to 1 for my Mac’s retina display was a trick that I did not find documented elsewhere.

2 – Instead of using the floor() and constrain() methods in p5, using the native JavaScript Math.floor, Math.min & Math.max object methods performed faster by a substantial margin!

There are probably more optimization tweaks to be made to the p5 version – to be continued…


Arduino/MicroView sound file controller & looper

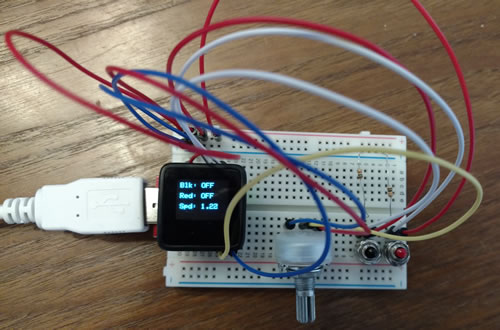
A recent challenge in the EDPX 4010 course was to connect an Arduino device via a serial port to control a p5.js sketch. In this case, we’re working with the Arduino-compatible MicroView module that is included in this SparkFun Inventor’s Kit.  I wanted to explore the p5 sound library further, so I made a simple device that controls the playback speed of an audio file (between 0 – 3x) with a potentiometer, and can also loop a chosen section of the audio file using pushbutton controls.
microview_project_smp5_arudino_screenshot
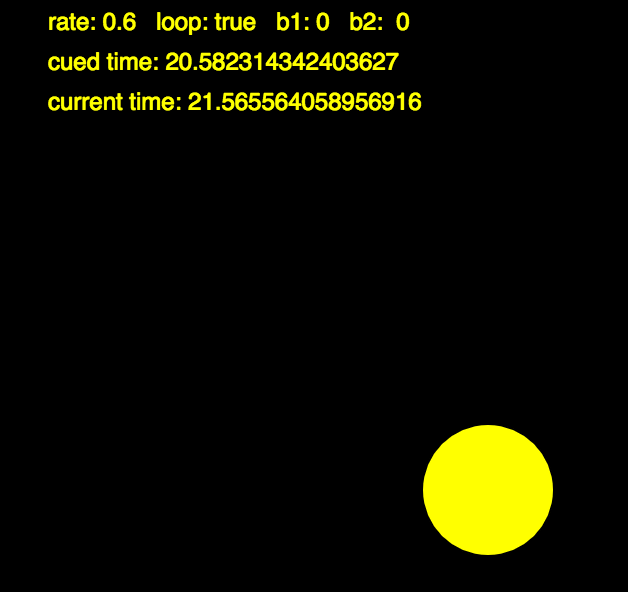
Pressing the black button sets the start point of the looped segment, and the red button sets the end point and begins the looped playback of that segment. Pressing the red button again will set another end point in the loop and shorten the looped segment even more, and the black button will stop the looping and continue the playback normally. The MicroView screen displays the playback speed of the audio and the status of the black and red buttons. The p5 screen (above right) displays the current playback rate, whether looping is on or off (true or false), the status of the pushbuttons, the start (cued) time of the loop, and the current time of the audio file’s playback. The size of the yellow circle changes based on the playback rate. The p5 source code for the project is available here, and the MicroView/Arduino source code is here.

For the serial port connection, I used the p5.serialport library, and also the p5.serialcontrol GUI application to perform the actual serial communication, since JavaScript in a browser can not interact directly with a serial port. To run this sketch, you must first open the serialcontrol application and then run the p5 sketch. Basically, the MicroView is sending three values as a comma-separated text string through the serial port: the “digitalRead” state of the two buttons (0 or 1), and the “analogRead” value of the potentiometer, mapped to 0-255. The p5 sketch receives this text and parses the values with the split command, separating by commas. The sketch then uses those values to affect the playback speed and looping parameters. It also contains some logic checks to prevent repeated triggering if a button is held down, so that a held push is registered as only one push and is not continually changing values (this technique is known as “state change” or “edge” detection).

Some glitches with the p5.sound library – before the playback of a loop begins, the library first stops the playing state, sets the loop cue times, and then restarts playing, which creates an audible short pause in the process. Also, I initially had the potentiometer control the direction as well as the speed, so that the audio could be played in reverse. However, the library seems to reset the playback point to the beginning of the file before it begins the reverse playback, so the forwards/backwards control does not sound seemless, always starting from the same point in the file. I’m interested in digging further into the code of the library itself to see if I can change that behavior.
400 robot heads

Assignment for 4010 course: create a grid of robot heads, 20×20, with four variations shifting between rows or columns. The center four should “make a robot sound when clicked”. If you click on the center four figures in this sketch, you’ll hear a random quote spoken in synthesized speech, via the p5.speech library.

The single eye of each head also follows the mouse location, utilizing p5’s “constrain” function. Source code available here. The quotes were selected from this collection.

Perlin noise “sound sphere” sketch

A sketch playing with the noise function of p5 and the sound library. The vertical positioning of each sphere, as well as the frequency of its oscillator, is shifted by stepping through the Y value of a noise sequence. The Z value of the noise sequence affects the diameter of the sphere and the amplitude of its oscillator.

Instructions:
Add the initial “soundsphere” by pressing the right arrow. Use the left & right arrow keys to delete or add more spheres. (You can add up to 20.)
Use the up and down arrows to adjust the speed of the step rate through the noise value.
Use the ‘a’ and ‘s’ keys to move the selector left or right (selector is displayed at the bottom).
Use the spacebar to change the wave type of the selected sphere (wave type will be displayed at the top right).
You can change the frequency range of the oscillator wave for the selected sphere using the following keys:
1 = Decrease lower limit of range by 50 Hz
2 = Increase lower limit of range by 50 Hz
3 = Decrease lower limit of range by 200 Hz
4 = Increase lower limit of range by 200 Hz
7 = Decrease lower limit of range by 200 Hz
8 = Increase lower limit of range by 200 Hz
9 = Decrease lower limit of range by 50 Hz
0 = Increase lower limit of range by 50 Hz
The lowest frequency limit is 60 Hz and the highest is 15 kHz.

The sketch will probably run more smoothly if you view it on its own page here. Source code available here and is commented in detail. One issue I’m noticing for future investigation – some audio “clicking” distortion occurs in certain frequency ranges.

Further exploration of arrays, objects and “scribbles” in p5

My latest experiment sketch with p5.js involving work with arrays. You will probably need to click on the image to activate it. Use the “t”,”s” and “c” keys on your keyboard to add a triangle, square or circle to the scene (size and color are randomized).

The sketch can be viewed on a separate page here (which will probably perform at a faster frame rate), and the p5 source code is available here. Each shape is added as an independent object to the master shape array. The number of elements currently in the master array is displayed at the top left. As the shapes fall and are shuttled off to the left or right (again, a random choice), they are “spliced” from the array after they leave the screen, hence why the count goes down.
This sketch also makes use of the p5.scribble library, which gives the shapes their jagged, “sketchy” appearance. If you un-comment the “randomSeed” statement in line 15 of the code, this will stop the animation of the jagged-ness, since the randomization used for that effect (in the p5.scribble code) is then “seeded” continually with the same number. (This number could be anything…not just “98”.)

Touchscreen pong with p5

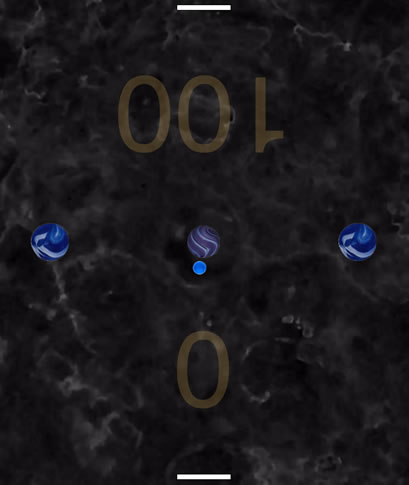
…so it’s not exactly an “extreme” or “ultimate” game of pong, but the challenge led me to try some previously unexplored functions in p5.js. This version currently works only with touch screens and is sized specifically for an iPad air: http://blog.rich-path.com/p5/pong/  (p5 source code is available here)
p5 pong game screenshot

Particularly interesting elements of developing the game for me were:

  • Coding the scoring system. Points are gained by each player when the small light blue marble “ball” hits one of the 3 larger marbles in the center (based on the direction of the ball). The 2 outer targets are worth 10 points, the middle is worth 20. The numbers display the accumulated score for each player; however, if a player misses the ball with their paddle, they lose all of the points that they scored during that round (their score resets to that of the previous round). The target hit detection makes use of p5’s dist() function.
  • Using the oscillators and envelopes in the p5.sound library. This example was particularly helpful in getting started with sound generation, though I by-passed the MIDI note conversion and am providing the oscillator with a specific frequency value. Also, to prevent an audible note from immediately playing at the start of the game, the oscillator is creating a super-low frequency of 1 Hz until a target is hit and a different tone is played…a bit of a hack until I come up with a better solution.
  • Use of the built-in touches array to detect fingers on a touch screen. I found the short example sketch listed in the first response from lmccart on this page to be quite useful in figuring out how to track (and limit the number of) touches on a screen. The paddles and ball won’t move unless at least one finger is on either side.
  • Changes in velocity depending on which part of the paddle hits the ball. Basically using a combination of the map() function and some hit-or-miss experimentation with calculations for this – the ball will move slower and more vertically straight when it hits the center of a paddle, and the angle and speed increases greatly towards the edges.

A simple sine wave scrolling landscape in p5

In this small sketch, four separate landscape ranges are created in a for loop (counting down the variable i from 5, so that the largest range gets drawn first to appear furthest in the background layers). The sin() function is fed with an ever slightly increasing amount (+.06 each frame) from the a variable (responsible for the wave shapes) and the changing i variable from the for loop, responsible for the height (and thus perspective depth) of each range. The a variable is also used to modulate the background color that slowly shifts from a blue sky to black night.

Source code available here.

Protected: Further thoughts and variations on the first video assignment

This content is password protected. To view it please enter your password below:

Protected: Draft of storyline for first 4010 video project

This content is password protected. To view it please enter your password below:

© 2025 Noises & Signals

Theme by Anders NorenUp ↑